- S&P 500SPY▲ +0.34%
- NASDAQ 100QQQ▼ −0.10%
- US 20YTLT▲ +0.84%
- GOLDGLD▼ −0.54%
- CRUDEUSO▼ −0.12%
- NVIDIANVDA▼ −0.29%
- APPLEAAPL▼ −1.00%
- MICROSOFTMSFT▼ −0.31%
- JPMORGANJPM▲ +0.52%
- EXXONXOM▼ −0.24%
- TSMCTSM▲ +1.16%
- ASMLASML▼ −0.99%
- TOKYO ELECTRON8035.T▼ −2.56%
- TSMC TW2330.TW▼ −0.62%
- SAMSUNG005930.KS▼ −2.98%
- INPEX1605.T▲ +0.45%
Today's focus
Traffic is 95% below typical levels. The disruption has lasted 222 days, with no recovery observed.
Which sector trends continue across markets?
Follow the moves, session by session.
Choose a sector and compare its six sessions in sequence.
Sessions run from left to right. Select a row to explore that sector's sequence.
Price moves and activity are z-scores: deviations from the usual level at that time. Lines mark observed temporal and structural continuity, not causation. Europe and NY pre-market overlap in time.
Compare with the original time-window view
Global session clock · Compare time windows
▲ Stronger than usual ▼ Weaker than usual · Values = activity (z)
Sector landscape · Most active sectors by market
Top 5 sectors · Price moves and activity (z) · Leading symbols
- 1 Utilities ▼ −0.27z 0.86z 9508.T, 9503.T, 9506.T
- 2 Real estate ▲ +0.06z 0.63z 3498.T, 8804.T, 3231.T
- 3 Financials ▼ −0.19z 0.52z 8725.T, 8766.T, 8750.T
- 4 Communication Services ▼ −0.21z 0.45z 4684.T, 9433.T, 593A.T
- 5 Energy ▼ −0.15z 0.41z 3315.T, 5021.T, 5019.T
- 1 Communication Services ▼ −0.10z 0.64z ZEG.L, INF.L, RMV.L
- 2 Financials ▲ +0.02z 0.51z PRU.L, LLOY.L, III.L
- 3 Utilities ▲ +0.12z 0.37z TEP.L, SSE.L, UU.L
- 4 Consumer cyclical ▼ −0.03z 0.36z HWDN.L, MKS.L, KGF.L
- 5 Real estate ▼ −0.05z 0.35z LMP.L, BLND.L, BBOX.L
- 1 Real estate ▲ +0.14z 0.52z WELL, O, EQIX
- 2 Consumer cyclical ▼ −0.06z 0.35z BKNG, AZO, TJX
- 3 Utilities ▲ +0.07z 0.31z AEP, CEG, XEL
- 4 Communication Services ▲ +0.08z 0.29z META, T, ASTS
- 5 Industrials ▼ −0.10z 0.23z BE, VRT, AAL
- 1 Consumer cyclical ▼ −0.04z 0.89z AZO, NKE, BKNG
- 2 Energy ▼ −0.19z 0.88z DVN, XOM, VLO
- 3 Consumer Defensive ▼ −0.33z 0.65z MNST, PEP, PG
- 4 Healthcare ▲ +0.00z 0.60z MRNA, LLY, PFE
- 5 Basic Materials ▼ −0.01z 0.58z SHW, AEM, B
- 1 Utilities ▲ +0.42z 0.79z XEL, AEP, EXC
- 2 Technology ▼ −0.05z 0.66z MSFT, AMD, INTC
- 3 Consumer cyclical ▲ +0.01z 0.39z BKNG, AMZN, MCD
- 4 Consumer Defensive ▼ −0.15z 0.35z COST, MNST, KO
- 5 Financials ▼ −0.04z 0.26z BRK-B, C, MA
- 1 Financials ▲ +0.14z 0.40z 7182.T, 8725.T, 8750.T
- 2 Utilities ▲ +0.06z 0.17z 9503.T, 9532.T, 9504.T
- 3 Real estate ▼ −0.10z 0.14z 8918.T, 3289.T, 3231.T
- 4 Healthcare ▼ −0.02z 0.08z 4568.T, 4502.T, 4519.T
- 5 Communication Services ▼ −0.10z 0.06z 4689.T, 9984.T, 593A.T
Public statements & markets
See when a statement was published and how prices moved around it.
Prices are actual 15-minute closes, plotted at each bar's end time. The red line marks publication. A price move after publication does not establish that the statement caused it.
Compare observed responses by event type with usual conditions


Recent statements Price response not yet measured
Shipping & commodity prices
Track shipping conditions and commodity prices across six key passages.
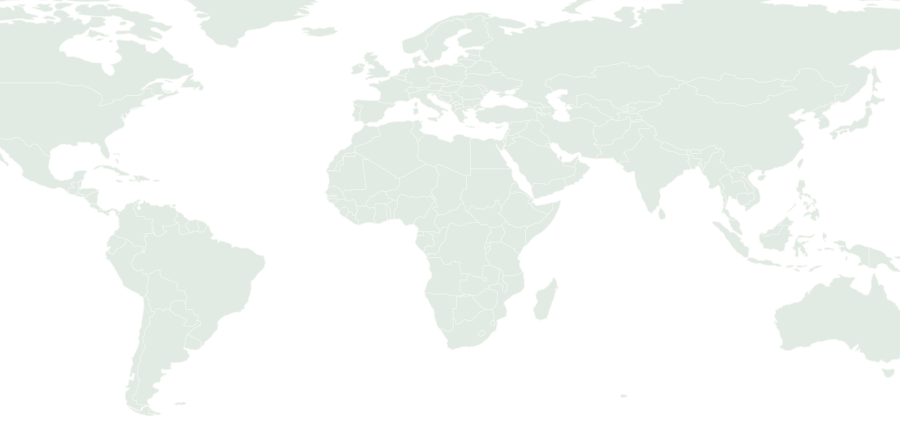 ATLANTIC OCEANINDIAN OCEANPACIFIC OCEAN
Compare vessel traffic and commodity prices
Fictional data Traffic, waits and prices are fictional UI samples. Prices and traffic share a time axis; this does not establish causation.
View the original observed snapshot 2026-10-11
These are the original observed values. They are separate from the fictional demo above.
| Straits | Recent change | Current level | Recovery | Routing | Transits / day | Versus typical |
|---|---|---|---|---|---|---|
| Strait of Hormuz Strait of Hormuz | No new change | Very little traffic | No recovery 0.07 | No alternative | 4.1 | -95% |
| Bab el-Mandeb Bab el-Mandeb Strait | No new change | Very little traffic | Partial recovery 0.78 | Unresolved | 28.3 | -49% |
| Suez Canal Suez Canal | No new change | Below usual | Partial recovery 0.55 | Diversion in place | 41.7 | -23% |
| Cape of Good Hope Cape of Good Hope | No new change | Normal traffic | — — | — | 84.0 | +70% |
| Panama Canal Panama Canal | No new change | Well below usual | Partial recovery 0.76 | Diversion in place | 25.9 | -19% |
| Strait of Malacca Malacca Strait | No new change | Normal traffic | — — | — | 233.0 | +13% |
Daily radar
Markets remain broadly weaker across 224 tracked symbols and 53 themes.